
 strategies have faced a myriad of challenges over the last few years, signaling a high failure rate. )
Return to Office (RTO) strategies have faced a myriad of challenges over the last few years, signaling a high failure rate.
A recent study discovered that 38% of employees have experienced two or more RTO policy changes since 2020. More than 6% of employees have endured five or more changes to their RTO policy. At least 75% of companies are not seeing attendance levels return to pre-pandemic levels, rendering their RTO policies in flux.
– Kawamoto, 2024

Employees face ambiguous RTO policies and uncertainty about who will be in the office when and how they’ll get their work done when they are there. However, when we consider the hospitality industry, a consistent guest experience is the number one success metric.
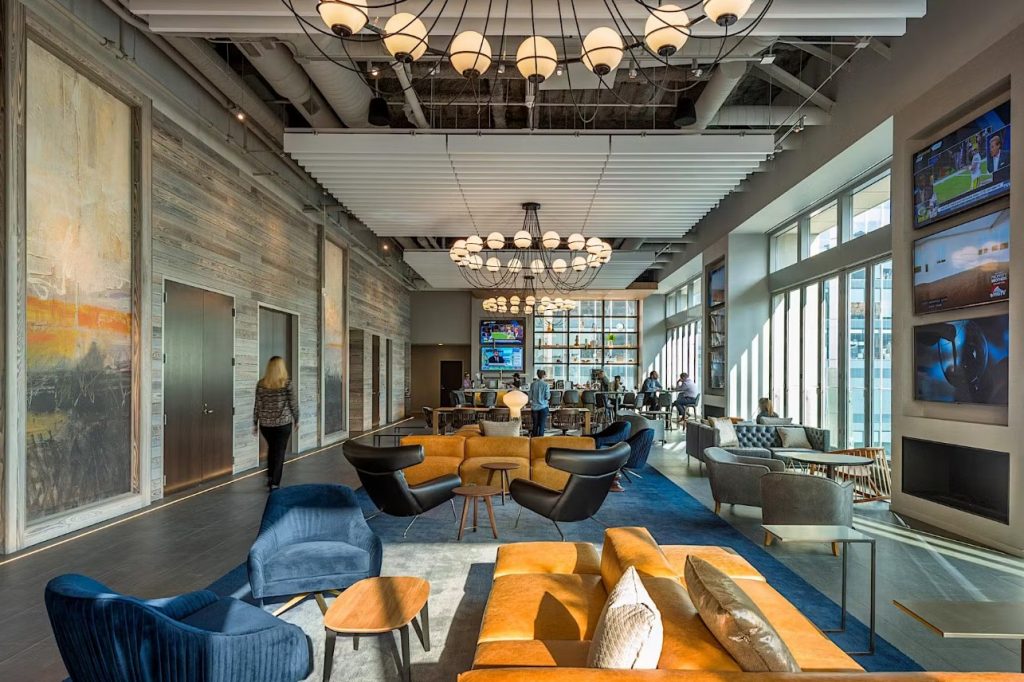
Hospitality and workplace are two sides of the same coin, providing flexibility and well-being to forge the gap between professional and personal life. In 2024, WDM published an article on hospitality’s qualitative influence on modern workplace design, Welcoming Workplaces: Hospitality’s Influence on Modern Workplace Design. McLaughlin and King adeptly researched what hospitality in the workplace should look like. But how can quantitative metrics from the hospitality industry inform our workplace design?
What if we thought about our talent as customers not costs?
The Hospitality Industry Knows Their Metrics
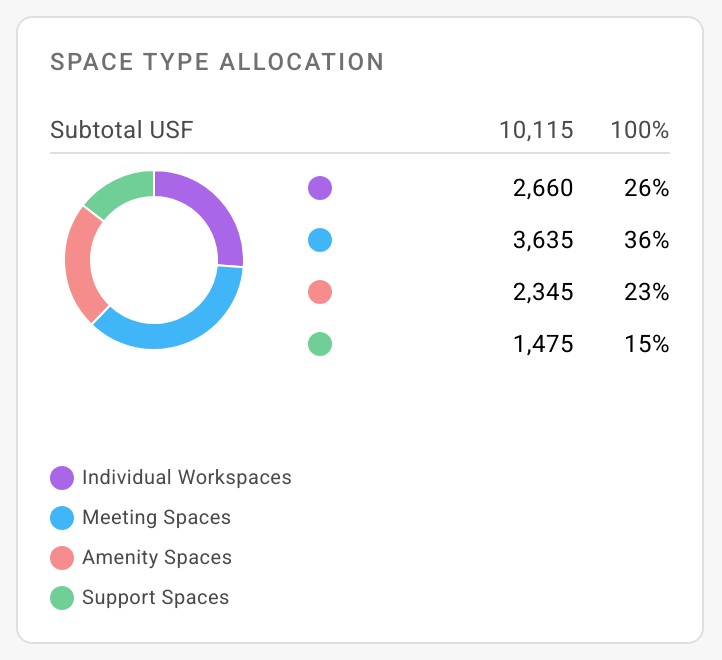
The hospitality industry relies on common metrics for allocation of square footage around a property. For example, space distribution for a hotel is 65-75% guest rooms, 10-20% amenities and 10-15% admin/support.
Can you site the allocation of spaces and their metrics around your office?
Utilizing the hospitality-as-workplace approach, the three C’s of a hotel guest experience (Stayntouch, n.d.) can be reinterpreted to inform the workplace metrics required:
- Communications: understanding the spaces available for work and the policies associated with each space type.
- Convenience: providing opportunities for employees to do focus work, find meeting and team spaces and the use of amenities for a myriad of workstyles.
- Choice: offering the ability for employees to customize their experience as their daily needs evolve.
These elements are considered crucial for achieving successful customer experience. So, how can our workplace metrics support communication, convenience and choice for talent And how can indefensible real estate guesstimates and assumptions about inadequate or excess space translate into key statistics for workplace decisioning?
Begin by identifying the types and quantities of each space in your office, particularly the Work Seats, Meeting Seats, and Shared Seats. Here’s a step-by-step guide for getting started.
Taking Inventory of Your Physical Space
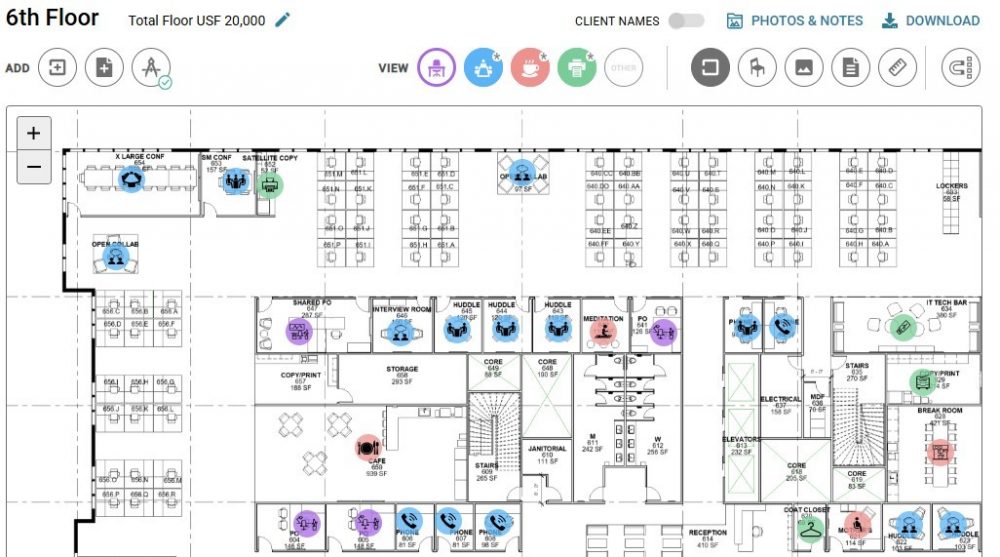
Capturing and translating your data into actionable insights is the first step in understanding the supply of office space that you offer. Here are four ratios to establish your workplace metrics:
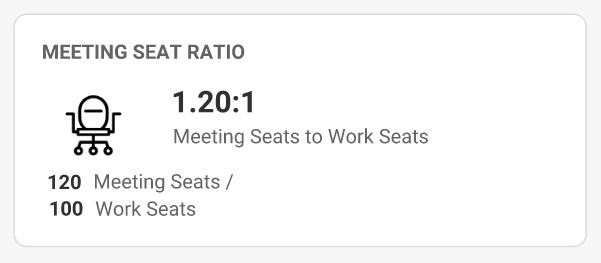
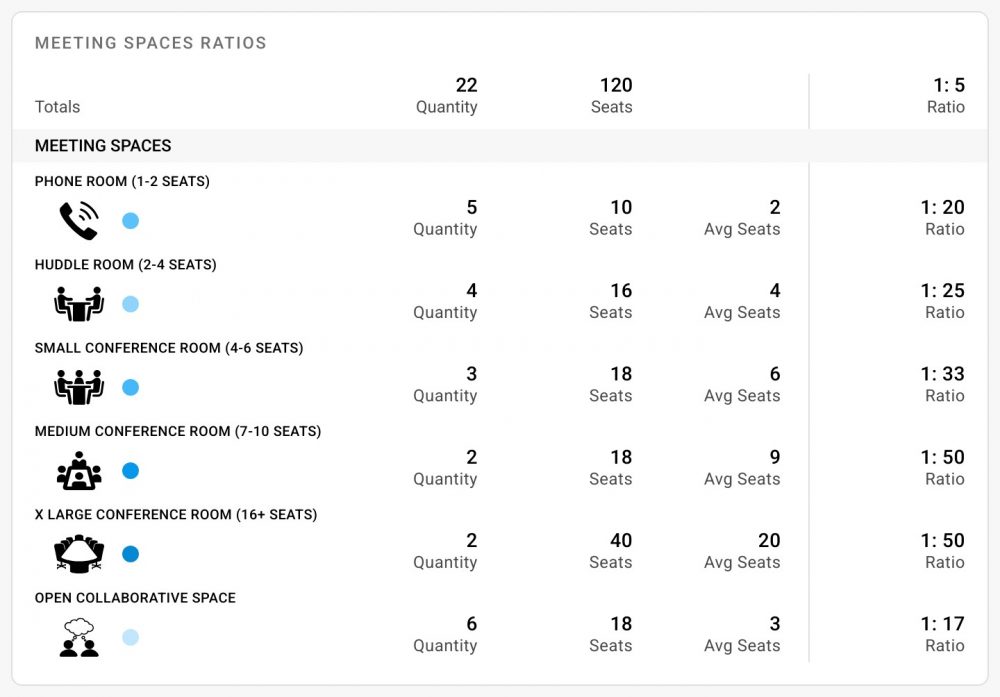
- Meeting Seat to Work Seat Ratio
How to Calculate: Meeting Seats ÷ Work Seats
Tip: show Work Seats as 1 in your ratios
Meeting Seats includes all chairs/benches/stools in both open and closed meeting spaces.
Work Seats includes all traditional individual workspaces such as workstations, hotel desks, and private offices.
Target Ratio Goal: More Meeting Seats than Work Seats
Target Ratio Range: 1.00:1 to 1.25:1
Translation: 1.20:1 ratio translates into 1 ⅕ Meeting Seats for every 1 Work Seat
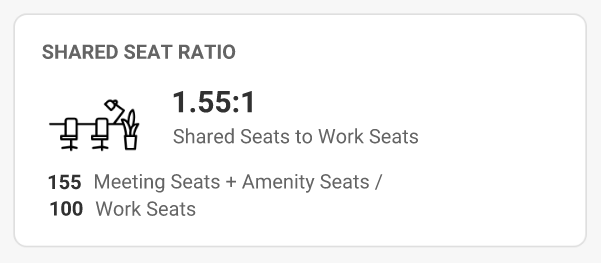
- Shared Seat to Work Seat Ratio
How to Calculate: Shared Seats ÷ Work Seats
Tip: show Work Seats as 1 in your ratios
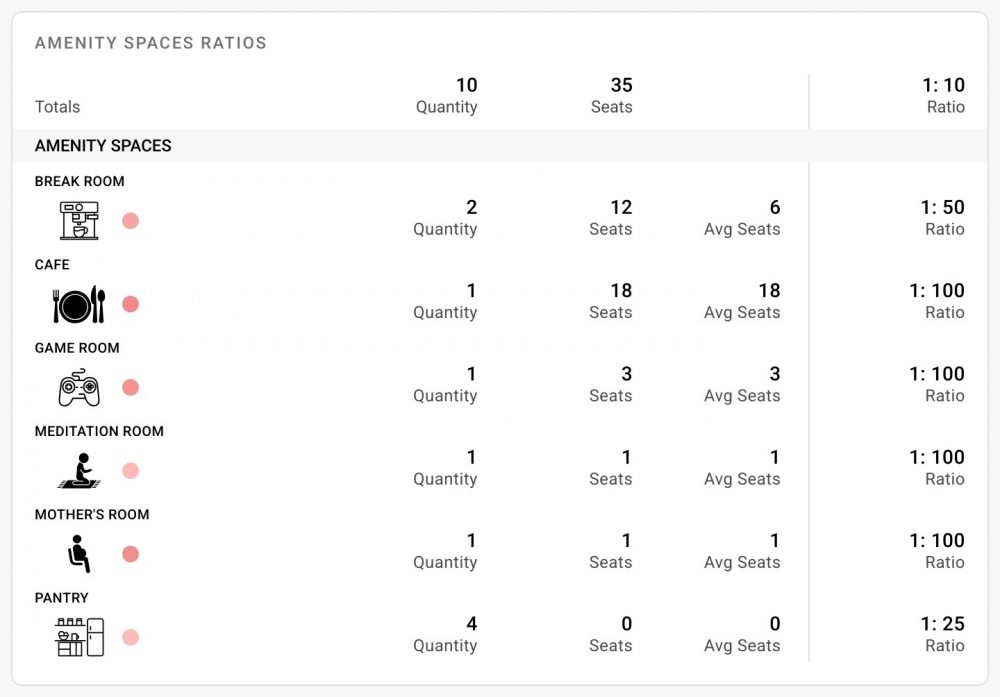
Shared Seats includes all chairs/benches/stools in both open and closed meeting spaces plus all amenity seats for an increased pool of seats from which to select.
Work Seats includes all traditional individual workspaces such as workstations, hotel desks, and private offices.
Target Ratio Goal: more Shared Seats than Work Seats
Target Ratio Range: 1.20:1 to 1.60:1
Translation: 1.55:1 ratio translates into approx. 1 ½ Shared Seats for every 1 Work Seat
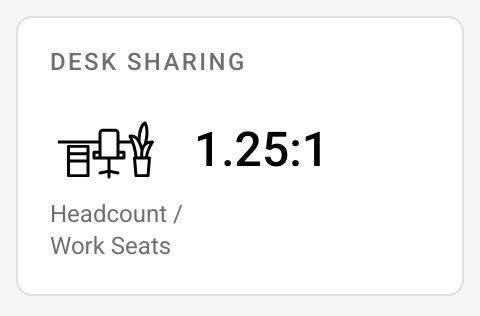
- Traditional Desk Sharing Ratio
How to Calculate: Headcount ÷ Traditional Workpoints
Tips: show Workpoints as 1 in your ratios
Headcount is the number of people at your organization.
Traditional Workpoints are synonymous with Work Seats and include all traditional individual workspaces such as workstations, hotel desks, and private offices.
Target Ratio Goal: less Workpoints than People to account for hybrid work
Target Ratio Range: 1.10:1 to 1.25:1
Translation: 1.25:1 ratio translates into 1 Workpoint for every 1 ¼ person
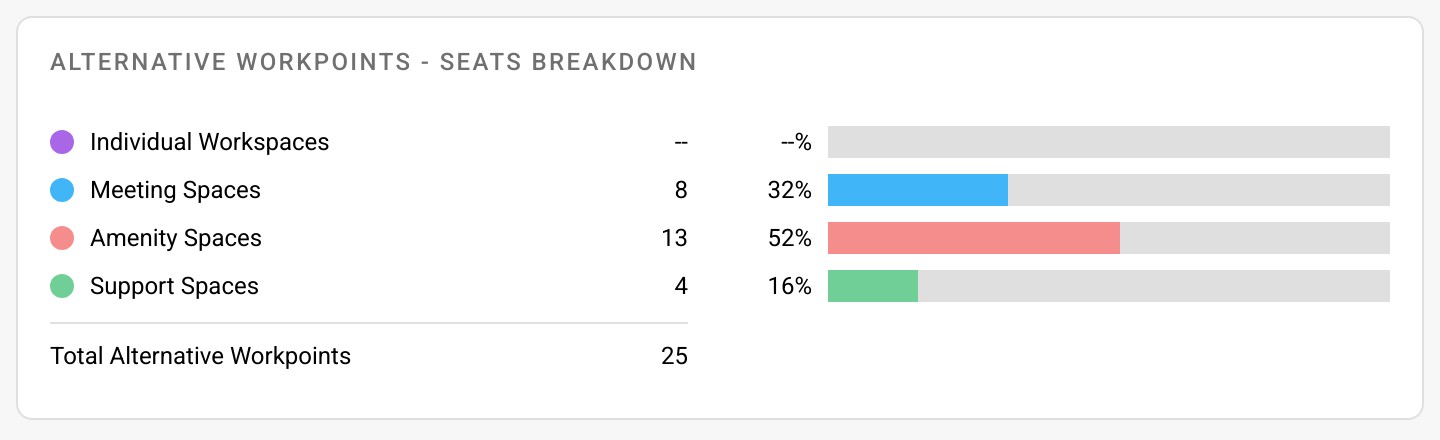
- Alternative Desk Sharing Ratio
How to Calculate: Headcount ÷ (Traditional Workpoints + Alternative Workpoints)
Tips: show Workpoints as 1 in your ratios
Headcount is the number of people at your organization.
Alternative Workpoints can include seats from meeting, amenity, and support spaces. Phone Rooms, Open Collab, and Cafés, for example, can serve a secondary function as heads down workspaces to make up for shortages in traditional Workpoints.
Target Ratio Goal: the same amount of Workpoints as People to account for everyone being in the office
Target Ratio: 1.00:1
Translation: 1.00:1 ratio translates into 1 Workpoint (which can be traditional or alternative) for every 1 person

To meet this moment, successful workplace environments should be reconfigured as a hospitality destination rather than a workplace obligation.
Lessons Learned in These Metrics
- Meeting Seat to Work Seat Ratio
What This Ratio Tells Us:
- When we don’t achieve at least 1:1, we fall short of providing a traditional Meeting Seat for every Work Seat.
- This explains why talent cannot find a place to meet in the office.
- Which in turn contributes to poor attendance because there are inadequate meeting spaces.
- Shared Seat to Work Seat Ratio
What This Ratio Tells Us:
- Although their primary function is as an amenity, some amenity seats (included in Shared Seats) can be specified in a way that they also serve as a collaborative Meeting Seat.
- When we don’t achieve more than 1:1, we don’t offer a meeting or amenity seat for every Work Seat.
- This explains why talent cannot find a place to collaborate, either at all or in a more hospitality-oriented manner.
- Which in turn contributes to dissatisfaction in the office.
- Traditional Desk Sharing Ratio
What This Ratio Tells Us:
- Now that we typically no longer assign a desk per person due to hybrid work, desk sharing no longer achieves a ratio of 1:1.
- This means when everyone comes into the office, there are not enough traditional Workpoints.
- Unsure of where to do heads down work, this is why talent voices their frustration.
- Alternative Desk Sharing Ratio
What This Ratio Tells Us:
- By identifying and allowing seats intended for other functions to be used as individual Workpoints, we provide a more flexible and hospitable workstyle.
- This allows talent to roam the office and remain inspired.
- By including these additional seats as alternative Workpoints, we can get closer to or even surpass our target desk sharing ratios.

Every hotel operator knows their property’s staff to room ratio and the square footage of various room types. Why then are office leases signed with limited data? Understanding how to identify space types in your workplace and how to calculate the key Workpoint ratios are essential to optimizing your space for maximum talent satisfaction.
Final Thought
Sir Richard Branson’s highly successful luxury lifestyle Virgin brand shook the hospitality industry by offering personalized experiences in 2010. Branson once said this about the talent who work for him, “Train people well enough so that they can leave. Treat them well enough so that they don’t want to,” (Branson, 2023). Why not apply that same logic to the physical spaces that we provide to our talent?
Much like the way convenience and choice drive successful hospitality strategies, flexible space types within our workspaces will bring success. Without a hospitality mindset, RTO will continue to face challenges in the years to come.
“Redefine your RTO policy so that people don’t feel obligated to come in but reconfigure your workspace so that they will want to anyway.”
– Alison Muh, 2025.
References
-
Branson, Richard. “Train people well enough so they can leave, treat them well enough so they don’t want to.” LinkedIn, 2023.
-
Kawamoto, Dawn. “Why employers continue to change their return-to-office policies.” June 2024.
-
StaynTouch. “The 3 C’s of Enhancing the Hotel Guest Experience.” Stayntouch, n.d.
All dashboard graphics are courtesy of Space Plan Wizard.