Haven’t taken our survey yet? You can still take it here! Read on for part two of a deeper dive into the results and make sure to check out the overview here and part one here.

In the first two articles, we discussed that the dominance of digital screens in our work and private lives is already “here and now” as opposed to being for the “future workplace”. We also explained that most screen-enhanced workspaces can be considered unique because the function of those spaces is truly in the eyes of the beholder – or in this case – worker.
In this article, we want to share the strategy we take when designing workplace design surveys. Specifically, why we ask the questions that we do and the insights we’re able to capture by taking an indirect questioning approach.
Asking Difficult Questions
When Survature undertakes a new project we face a lot of unknowns. Our foremost challenge is knowing how to ask difficult questions in the best way. Without this, the joke of “there is not always a lot of evidence in evidence-based design” could end up being the reality of a project.
This issue is not solely in workplace design research. Over the past several decades, many innovators have faced the same challenge during their explorations. One of the most notable examples are the NASA engineers and scientists who built the Apollo program that took mankind to the Moon. While there have been many thought-provoking ways to describe this challenge, one of the most succinct ways is:

Only after we know how to ask the question can we begin to chisel away at the problem and build the solution. For workplace design, that question is: How do people really work? – a question we’ve been answering throughout this series.
While traditional questionnaires and focus groups have attempted to ask this question, the fact of the matter is that the answers received are for a considerably simpler question – What are the activities people do at work?
Notice the difference?
New Science, New Approach
Fortunately, science and technology advancements from multiple fronts are creating an unprecedented opportunity for the workplace design community.
The first advancement is Data Science. Using modern data science to accurately infer and predict is becoming commonplace. This technology lessens our burden of directly asking a question in the hopes that people can or will answer with complete honesty. This is because we can now digitally “observe” behavior unobtrusively through a new innovation called behavior-enabled surveys (BES). This new technology allows us to capture more honest feedback to answer – How do people really work?.
The second advancement is the significant progress in our understanding of Knowledge Work that comes from research in Economics and Management Science. The term “Knowledge Worker” was coined by Peter Drucker in his 1969 book, “The Age of Discontinuity”. He also discussed the importance of increasing knowledge worker productivity in his 1999 article “Knowledge-Worker Productivity: The Biggest Challenge” where he argued that “the most valuable asset of a 21st-century institution, whether business or non-business, will be its knowledge workers and their productivity.” Now, 50 years later, the workplace design industry can and should leverage new scientific innovations to leap beyond work/job activities by finding new depths of understanding who a client’s workers are, what they actually do in their job (beyond their job description), and how they really work.
How to Ask the Right Questions
We have developed ways to ask the right questions using our behavior-enabled survey (BES) tool and confirmed the effectiveness of those questions with the Work Design Magazine audience through our Screen-Centric Future study. Now we are going to pull back the curtain and show you which questions in our survey were aimed at better understanding the who, what, and how of Work Design Magazine’s readers:
Question 1:

Question 2:

The strategy in using these questions (and the key to their proven success) is that they are straightforward and easy for anyone to answer. We can all answer these questions without needing to think hard.
We have to acknowledge that the growing screen-centric workplace offers an unprecedented and unique opportunity for researchers because this new digital information age has a centralized focal point – digital screens. By playing a pivotal role in the modern workplace, the topic of screens gives us a powerful way to ask about how people really work.
It’s important to also note that these two questions were asked using Survature’s proprietary technology – the AnswerCloud™ – which is at the core of BESs. It is how we are able to observe people’s behavior to better understand their needs. If you were to use this same question in a traditional survey environment, you would only get 10 percent of the data we can capture from the AnswerCloud which could lead to less-informed decisions in design. That is because using a full-fledged data analytics platform, such as Survature, allows you to accurately infer and predict people’s mental priorities automatically. Traditional methods (analyzing spreadsheet after spreadsheet) cannot get you there, unfortunately.
In the following sections, we show how these questions were presented in the survey environment and how they can work to your advantage towards obtaining better information.

Advantage 1 – Knowledge Work Indicators
By using an AnswerCloud question (Image 1) where we ask about the importance of certain aspects of work, we can see where people are on the knowledge work scale using not just their explicit answers but also their implicit behavior. We have found through recent research on Corporate Innovation, especially when facing market or technology disruptions, that the interpretation of this knowledge work scale is directly tied to grassroots leadership within a workforce. Therefore, we are calling this new measurement the Leadership Quotient (LQ).
From the data we collected in the Leadership Quotient Measurement AnswerCloud, we created two categories: LQ – High and LQ – Medium. LQ – High are those individuals with the highest LQ, meaning all five aspects of work (processes, team work, quality, service/product, and efficiency) are important to them. LQ – Medium are people with a medium level LQ where at least one item beyond efficiency is important to their work, but not all items are of importance to them.
Workplace design professionals as a whole are a part of a community driven by knowledge work activities which is reflected in our data as no participant fell into LQ – Low. People at this level only care about work efficiency and nothing else.
Below is a breakdown of LQ – High and LQ – Medium by position based on the responses we collected from the Work Design Magazine audience in the Screen-Centric Future study:
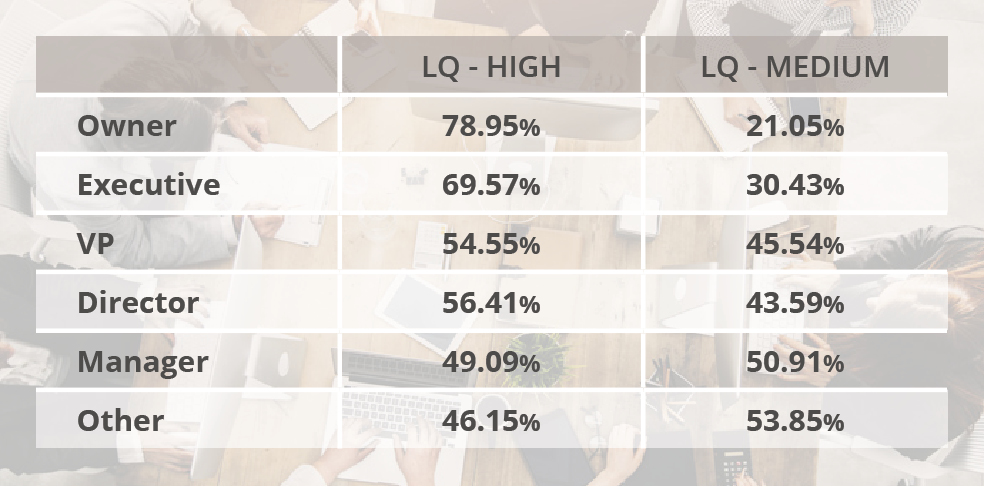
Please note that across the board a much larger percentage of Work Design Magazine readers fall in the LQ – High level than most other industries. The key thing to note is that with the LQ AnswerCloud question we can breakdown any position inside a corporation to truly see what they actually do.
After understanding where workers fall within the LQ dimension, it is then the designer’s job to create a space that can maximize the key items that matter the most. Understanding what truly matters most to workers based on their LQ is where the implicit behavior information captured from the AnswerCloud can be used.
Below is a comparison from the Screen-Centric Future study of Work Design Magazine readers who are LQ – High vs. LQ – Medium:

The results show how people that are LQ – High differ from those who are LQ- Medium. Looking along the X-axis, this tells us where people explicitly “dropped” each answer in the AnswerCloud (Not at all to Extremely). The Y-axis is the implicit behavior we were able to capture using a BES which shows people’s top-down-attention by level of priority. The more to the right a bubble appears, the more important an aspect of work was based on what people “said” explicitly. The higher a bubble appears, the higher the mental priority based on people’s implicit behavior.
We can see from this image that LQ – Medium people (navy bubbles) prioritize efficiency (D) high above anything else, however, they also showed that work quality (B) is a priority. LQ – High people (orange bubbles) had a cluster of three items that were all almost of equal priority and were explicitly rated as being of extreme importance (further to the right than the LQ – Medium bubbles). These three items are: efficiency (D), work quality (B), and processes (E).
In creating the best environments for these different types of workers, designers can use this data to design a space that’s more than just for the activities done. The space will take into account what people are actually doing. Additionally, it also helps to prioritize the types of spaces that need to be addressed. As discussed at the beginning of this section, the Leadership Quotient indicates the level of knowledge work that is being done. People at the LQ – High level are typically doing work that leads to innovations and advancements within the company, therefore, designing spaces that enhance their ability to do their work should be a high priority.
Next, we will discuss how the second question, In meetings, how important are screens to help your team achieve the follow?, can help us determine what people actually do at work.

Advantage 2 – Screen Impact on Workplace Information Flows
Now that we have discussed our discovery of the Leadership Quotient (LQ) and what it means, let’s take a look at how we can apply this new segmentation to better understand what each group really does within their teams. Let’s first breakdown these LQ segments further by job position. In this example, we will look at architects who are at the LQ – High level. Below is how they answered the above AnswerCloud question:

As in our example in the previous section, the X-axis is the explicit stated importance of each information flow option. The Y-axis is the true priority we predict based on their survey taking behavior. The top-3 information flows of true priority to architects when working within teams are: present ideas (G), share experiences (I), and reach consensus (H). What’s most interesting in this data is that even though monitor / refine plan execution (F) was given a rather high stated (explicit) importance, that item rates very low as being a true priority (implicit) to this group of LQ – High architects.
Let’s now take a look at the workplace information flow that matters most to architects who have medium level LQ. Below is the data we captured for this segment:

In contrast to the LQ – High segment, these people’s top-three priorities include two different items: exchange ideas / opinions (D) and access information (A). Similar to the other segment, monitor / refine plan execution (F) is the lowest priority. In contrast to LQ – High, evaluate options (C) is also a low priority.
Tying It All Together
You might be asking at this point how you should use this information in creating a design strategy for your client. There are several things you can do once you obtain this data for a project. First, the mere fact that you now know more about your client’s workforce than they probably do is an invaluable advantage to being a true consultant and adviser. You also now have clear evidence you can show your client that proves why certain design decisions are being recommended – and it’s all backed by data science. Internally, it helps in giving you and your team a clear direction to take. It’s also important to mention that depending on the information captured from these questions – there may be a need to ask further questions either in a follow-up survey or in interviews. This all depends on the nature of the project and your client.
In Article 3 of this series, we will discuss how these information advantages can help add precision in workplace strategies. Specifically, we will be discussing the Generalist-Strategist Continuum which is becoming a more important topic to organizations looking towards the future workplace.
While we’ve been able to share with you the highlights of our findings in this study, we still have barely scratched the surface of the insights uncovered. If you have enjoyed reading our overview and Articles 1 & 2, and are curious to learn more, we would like to offer you an opportunity to talk more about evidence-based design with us. Please follow this link so we can be in touch.
Art is mostly kind of important things to develop because it will be useful to increase creativity like written in http://news.unair.ac.id/2019/04/29/science-art-media-mahasiswa-saintek-mengasah-kemampuan-desain-dan-video/
This was a great read! It is definitely all about asking the right questions.
Having read this I believed it was really informative. I appreciate you taking the time and effort to put this content together. I once again find myself spending a significant amount of time both reading and commenting. But so what, it was still worth it!